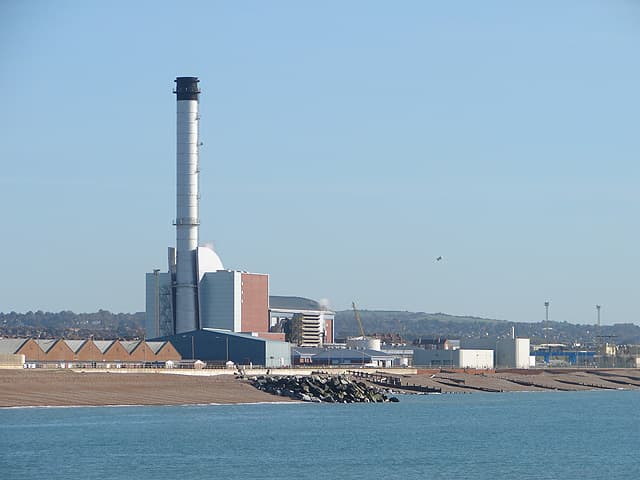
This chart shows an estimate of how much power the site was producing (or using) in each half-hour over the past week. It isn’t the official metered data, which arrives about a week later. Instead, it’s calculated from data that generators send to National Energy System Operator (NESO).
We combine:
- • The output the generator planned to produce (PN)
- • Any curtailment instructions from the system operator
- • Limits on how much the site can export or import
For storage technologies (Battery, Pumped Storage), the values may be positive (sending power out to the grid) or negative (taking power in).
The result is a good real-time picture of how the plant is behaving – including curtailment for wind, or charging/discharging for pumped storage and batteries.